Wisconsin Latino Family and Youth Study: Brown County Demographic Snapshot
Total Latino Population and its Growth over Time
Since 2000, Brown County’s population has risen 13% while the Latino population has more than doubled; the increase among Latinos has accounted for 40% of the county’s population gain.
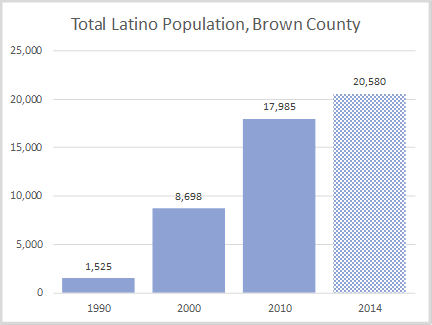
Total Latino Population Brown County
| 1990 Census | 2000 Census | 2010 Census | 2014 Estimate | |||||
| Population | Number | Percent | Number | Percent | Number | Percent | Number | Percent |
| Total | 194,594 | 226,778 | 248,007 | 256,670 | ||||
| Latino | 1,525 | 0.8% | 8,698 | 4.0% | 17,985 | 7.3% | 20,580 | 8.0% |
Municipalities with Highest Percentages of Latino Residents, Brown County, 2010-2014¹
| Municipality | Estimated Population | Estimated Latino Population | Pct. Latinos | Pct. of Latinos in Co. |
| Green Bay city | 104,574 | 13,422 | 12.8% | 69.1% |
| Bellevue village | 14,936 | 1,536 | 10.3% | 7.9% |
| Wrightstown village | 2,894 | 266 | 9.2% | 1.4% |
| Allouez village | 13,948 | 915 | 6.6% | 4.7% |
| Howard village | 18,313 | 1,103 | 6.0% | 5.7% |
| Wrightstown town | 2,409 | 143 | 5.9% | 0.7% |
| Rockland town | 1,715 | 75 | 4.4% | 0.4% |
| De Pere city | 24,216 | 1,047 | 4.3% | 5.4% |
Based on the 2010 – 2014 American Community Survey (ACS) estimates, one in eight residents of Green Bay are of Latino origin. More than two-thirds of the county’s Latinos live in the city, with most of the balance in seven other municipalities.
¹Five-year ACS data for 2010-2014 is the only source of municipality-level estimates more recent than the 2010 Census for many demographic, social, and economic characteristics. Because of margins of error, caution should be exercised in drawing conclusions from the ACS for small areas.
Latino Population by Census Block, Brown County: 2010
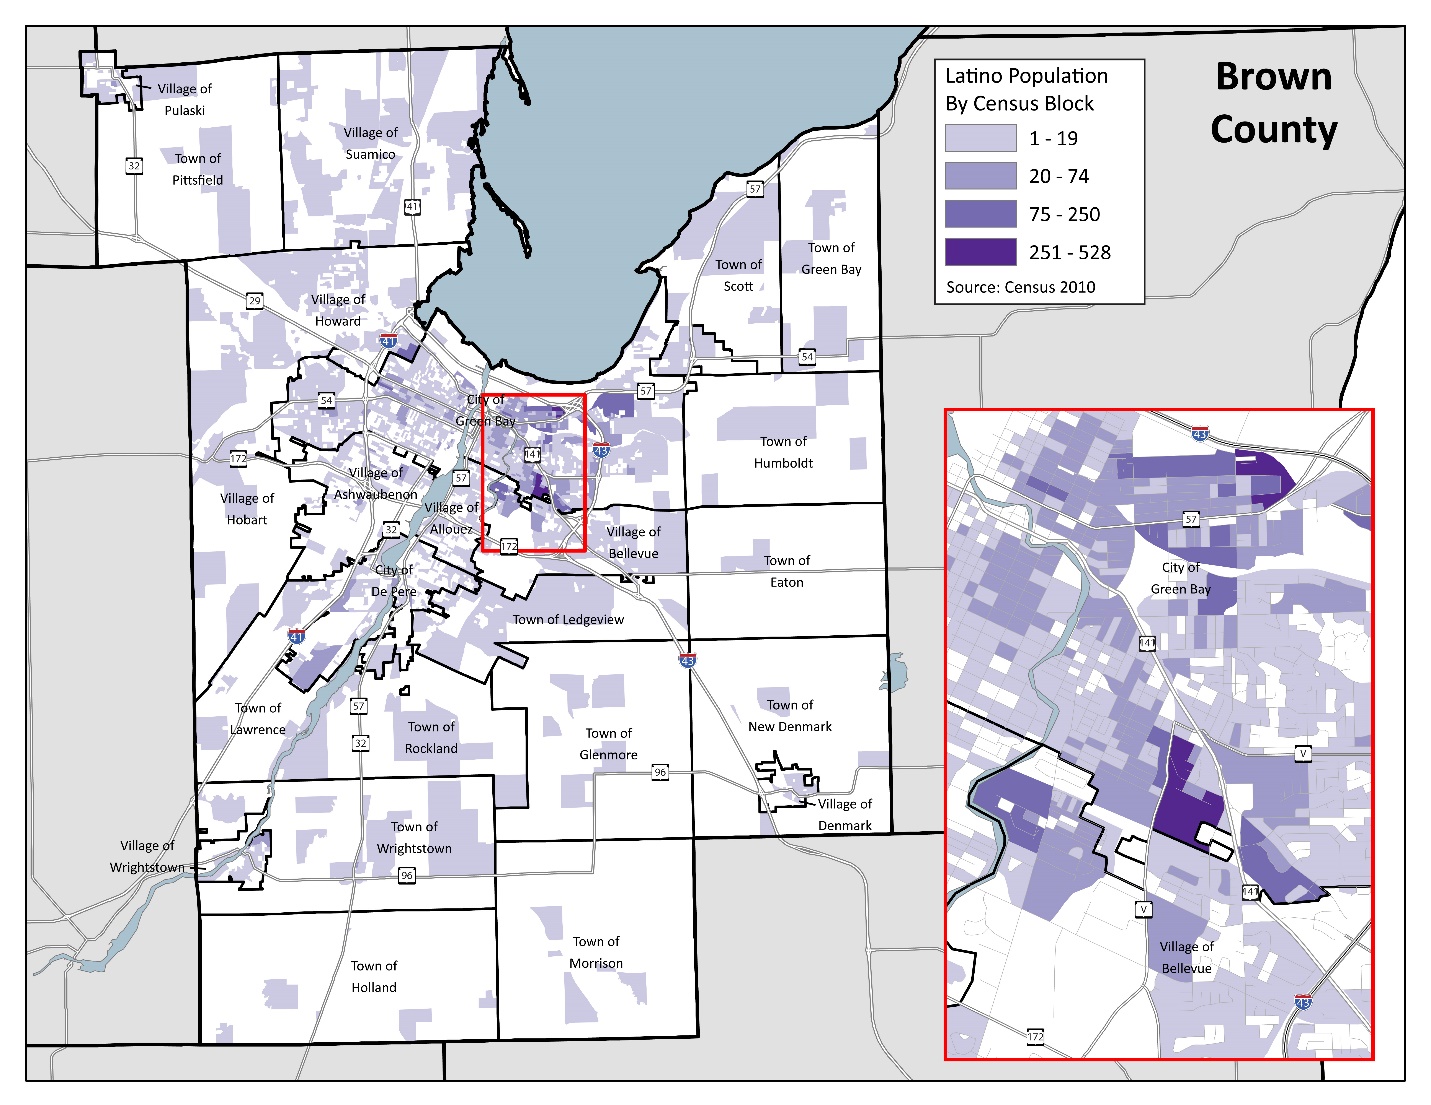
Block-level maps, available only from the decennial Census, reflect the higher numbers of Latinos in the areas east of downtown Green Bay; the southeast part of the city near U.S. Highway 141 and County V; and east of the I-43/Highway 57 interchange. The map also shows scattered populations of Latinos through most of the other municipalities in Brown County.
Age and Sex Patterns
Population by Five-Year Age Groups, Non-Latino and Latino Population, Brown County, 2014
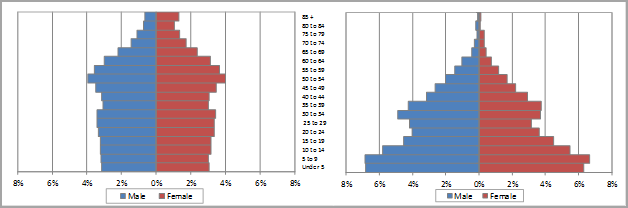
Population by Five-Year Age Groups, Non-Latino and Latino Population, Brown County, 2014
Comparing the age structure of Brown County’s non-Latino and Latino populations indicates their very different age distributions. In 2014:
- 25% of the non-Latino population was ages 0-19, while the comparable Latino percentage was 47%.
- 33% of the non-Latino population was ages 20-44, while the Latino percentage was 38%.
- 28% of the non-Latino population was ages 45-64, while the Latino percentage was 13%.
- 14% of the non-Latino population was ages 65 and older, while the Latino percentage was 2%.
The median age for the county’s non-Latino population in 2014 was 38.7, while the median age of the Latino population was 22.0, or nearly one-half that of non-Latinos.
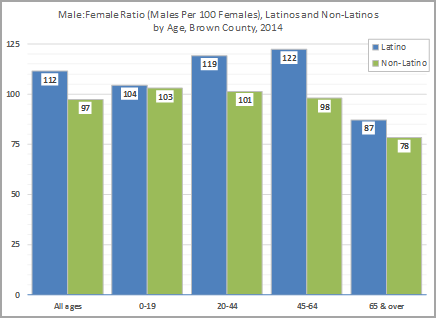
Male to Female ratios in Brown County 2014
The male:female ratios of Latinos are higher than the corresponding ones for non-Latinos. For all ages in Brown County the ratio of Latino males to females is 112 to 100; among non-Latinos, there are fewer men than women. High male-to-female ratios are particularly evident in the prime working age categories of 20-44 and 45-64.
Housing and Household Patterns
Given that the Latino population is younger, it is not surprising that the proportion of Latino-headed households who are renters is much higher generally than among non-Latinos. In Brown County, two-thirds of Latino-headed households rent, compared to one-third of non-Latino households.
| Latino Households |
Non-Latino Households | |||
| Tenure | Estimate | Percent | Estimate | Percent |
| Owner occupied | 1,384 | 33% | 64,218 | 67% |
| Renter occupied | 2,769 | 67% | 31,334 | 33% |
| Units in | Latino Households |
Non-Latino Households | ||
| Structure | Estimate | Percent | Estimate | Percent |
| 1 | 1,925 | 46% | 68,535 | 72% |
| 2 to 4 | 809 | 19% | 8,922 | 9% |
| 5 to 9 | 893 | 22% | 6,825 | 7% |
| 10 or more | 382 | 9% | 10,215 | 11% |
| Mobile home | 140 | 3% | 1,050 | 1% |
With a higher share of renters than owners, Latinos also tend to be more likely to live in multi-family than single-family housing units. In Brown County, one-half of Latino-headed households live in multi-family housing (structure with 2 or more units), compared to only one-quarter of non-Latinos.
The Latino population tends to live in family households at rates greater than the non-Latino population. In Brown County, nearly one-half of Latino households are married couples with children, and another nearly one-quarter are single parents with children. In contrast, non-Latino family households tend primarily to be made up of married couples without children in the home (influenced by the age pattern: many of these couples are likely “empty nesters” whose children have grown and moved away) and single people living alone.
| Latino Households |
Non-Latino Households | |||
| Household Type | Estimate | Percent | Estimate | Percent |
| Family households: | 3,405 | 82% | 61,569 | 64% |
| Married couples, no children | 361 | 9% | 28,672 | 30% |
| Married couples, with children | 1,886 | 45% | 19,440 | 20% |
| Single parent with children | 974 | 23% | 8,505 | 9% |
| Other families | 184 | 4% | 4,952 | 5% |
| Nonfamily households: | 748 | 18% | 33,983 | 36% |
| Householder living alone | 471 | 11% | 27,400 | 29% |
| Householder not living alone | 277 | 7% | 6,583 | 7% |
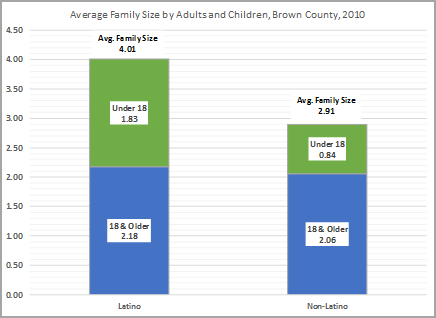
Average Family Size Adults and Children, Brown County 2010
Because more Latinos live in family arrangements and, more often than not, have children in their households, their average household and family sizes are larger than those of non-Latinos. In Brown County, the average Latino-headed family has just over 4 members, while non-Latino families average about 2.9.
Virtually all of the difference in average family size is due to more children being present in Latino families
Immigration and Countries of Origin
In Brown County, two of every five Latino residents were born in Wisconsin. A nearly equal proportion are estimated to have been born in foreign countries. (At the state level, 64% of Latinos were born in the U.S.—45% specifically in Wisconsin—and 30% were foreign-born.)
| Place of Birth | Total | Percent |
| Born in Wisconsin | 7,670 | 40% |
| Born in another state in the U.S. | 3,347 | 17% |
| Native; Born outside the U.S.* | 1,088 | 6% |
| Foreign Born | 7,310 | 38% |
*Includes Latinos born in Puerto Rico, and those born in other countries who have at least one U.S. parent
| Country/Region | Total | Percent |
| Mexico | 14,043 | 72% |
| Puerto Rico | 1,886 | 10% |
| Central American | 1,649 | 8% |
| South American | 416 | 2% |
| Others | 1,421 | 8% |
Nearly three of four Latinos in Brown County identify Mexico as their country of heritage or origin, and ten percent report Puerto Rico. Other Central and South American countries and some Caribbean nations (e.g., Cuba, the Dominican Republic) account for the balance.
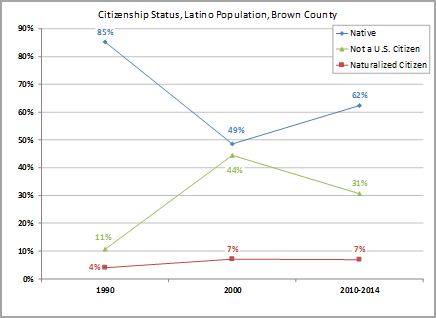
Citizenship status, Latino population, Brown County
With regard to citizenship status across the past 25 years, immigration to Brown County during the 1990s was robust, producing a sharp rise in the number and percent¬age of non-citizen Latinos, and a consequent decline in the percentage of native citizen Latinos (even though numeric increases were strong). However, over the past 15 years the percentage of native citizens rebounded, with a resulting decline in the share of non-citizens.
Language Ability
In Brown County, one-fourth of Latino residents reported speaking only English at home, while nearly three-fourths report speaking Spanish as their primary home language.
Among those who use Spanish at home, seven out of ten reported also speaking English “very well” or “well.”
| Language Spoken at Home | Estimate | Percent |
| English only | 4,154 | 25% |
| Spanish | 12,414 | 74% |
| Other language | 94 | 1% |
| Of those that speak Spanish at home, they also report that they: | ||
| Speak English “very well” | 6,045 | 49% |
| Speak English “well” | 2,453 | 20% |
| Speak English “not well” | 2,340 | 19% |
| Speak English “not at all” | 1,576 | 12% |
Note: Universe for this measure is population 5 years of age and older
Labor Force
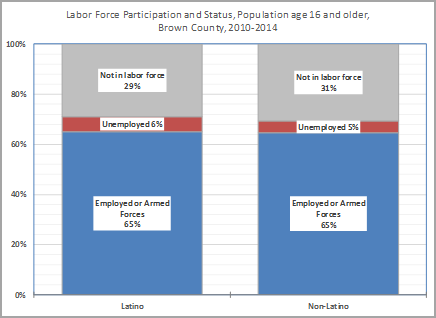
Labor Force Participation and Status, Population age 16 and older, Brown County 2010-2014
In looking at employment among Latinos and non-Latinos, in Brown County the participation rates in the labor force are very similar. Because non-Latinos are relatively older, it is not surprising to see a higher percentage for those not in the labor force. State-wide, Latinos’ corresponding labor force percentages were 64% employed, 7% unemployed, and 29% not in the labor force.
| Total | Male | Female | ||||
| Employment Status | Estimate | Percent | Estimate | Percent | Estimate | Percent |
| Employed or in Armed Forces | 7,520 | 65% | 4,646 | 75% | 2,874 | 53% |
| Unemployed | 703 | 6% | 393 | 6% | 310 | 6% |
| Not in labor force | 3,339 | 29% | 1,151 | 19% | 2,188 | 41% |
| Industry | Estimate | Percent |
| Manufacturing | 2,648 | 43% |
| Entertainment, recreation, accommodation, food services | 855 | 14% |
| Retail Trade | 569 | 9% |
| Education, health care, social assistance | 430 | 7% |
| Agriculture, forestry | 423 | 7% |
In Brown County, more than four out of ten Latinos reported being employed in manufacturing in the latter part of the last decade. Statewide, the percent in manufacturing was only 25%, with higher shares in the education, health care and social assistance (14%) and entertainment, recreation, accommodation and food services (15%) categories.
²The years 2006 – 2010 are the most recent period for which occupation-by-industry estimates are available.
Education
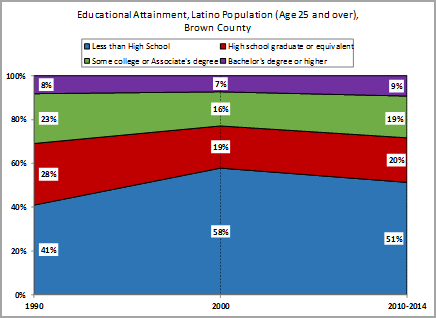
Educational Attainment, Latino Population age 25 and over, Brown County
Over the past 25 years, the educational attainment of Latinos in Brown County has been reflective of the pattern of recent arrivals. Brown County’s Latino population nearly quintupled from 1990 to 2000; many were foreign-born non-citizens (see graph in “Immigration and Countries of Origin” section earlier). Consequently, the share of those who had less than a high school education rose from 41% in 1990 to 58% in 2000. In the past 15 years, gains in Brown County’s Latino population have been robust but more tempered than the 1990s. The proportion of Latinos without a high school diploma has fallen to 51%, and other higher categories have risen.
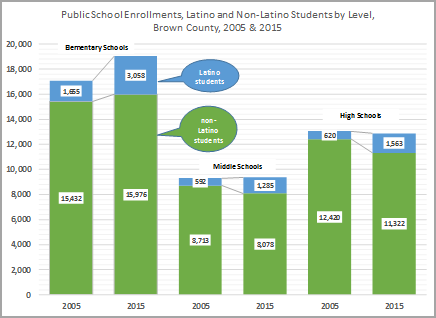
Public School Enrollments, Latino and Non-Latino Students by Level, Brown County, 2005 and 2015
In terms of public school enrollments, the number of Latino students nearly doubled at the elementary level, more than doubled in the middle schools, and rose 150% in the high schools from 2005 to 2015. These increases helped to boost elementary enrollment and to sustain overall totals at the middle and high school levels as non-Latino enrollment declined.
Income and Poverty
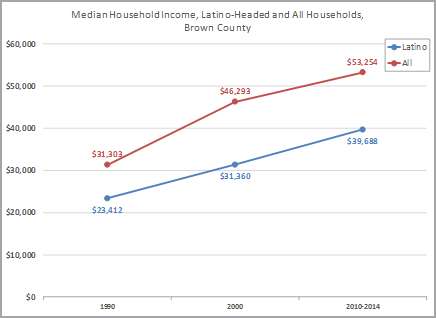
Median Household Income, Latino=Headed and All Households, Brown County
The median income for Latino households in Brown County has been consistently lower than that for all households. It was 75% of all households in 1990, dipped to 68% in 2000 (influenced by an influx of new immigrants in the 1990s) and returned in recent years to 75%. Statewide, Latino households’ median income was approximately 70% of that of all households during 2010-2014.
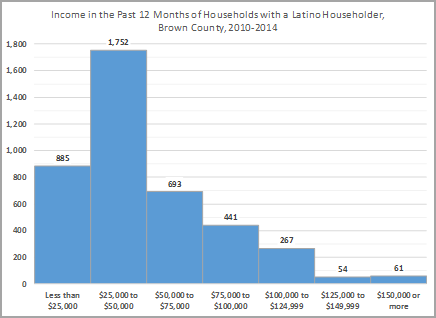
Income in the Past 12 months of Households with a Latino Householder, Brown County, 2010-2014
The incomes of Brown County’s Latino households are concentrated between $25,000 and $50,000; more than four of ten households had incomes in this range. Roughly 20% of households had incomes below $25,000, and just under 20% had incomes from $50,000 to $75,000.
| Latino Families | ||
| Household Type | Estimate | Percent |
| Families with income in the past 12 months below poverty level: | 747 | 22% |
| Of those families in poverty: | ||
| Married couple family | 381 | 51% |
| Male householder, no wife present | 59 | 8% |
| Female householder, no husband present | 307 | 41% |
The poverty rate for Latino families in Brown County was 22% during the 2010-2014 period, compared to 8% for non-Latino families. Of Latino families with incomes below the poverty line, one-half were married-couple families with children, and four of ten were female-headed households.