Extension’s mission is to connect people with the University of Wisconsin. We teach, learn, lead and serve, transforming lives and communities.
Want to get the latest updates from Extension directly in your inbox?
Free Parenting Classes
Connect with other parents. Get practical, positive parenting ideas. Help children grow.

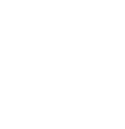
Join a StrongBodies Class
StrongBodies envisions a diverse community of individuals who are fit, strong, and healthy – and become change agents where they live.
Supporting Youth Mental Health
Multi-lingual resources for adults to support youth and their mental health

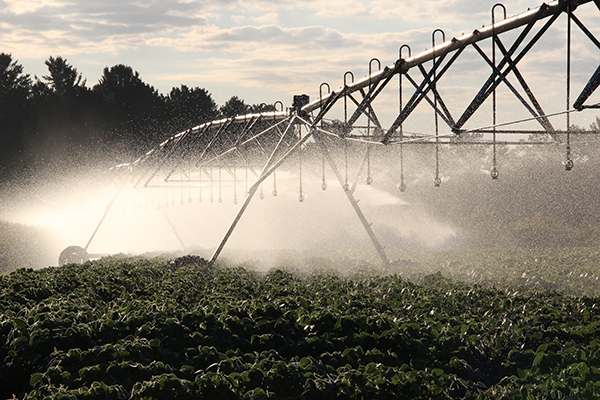
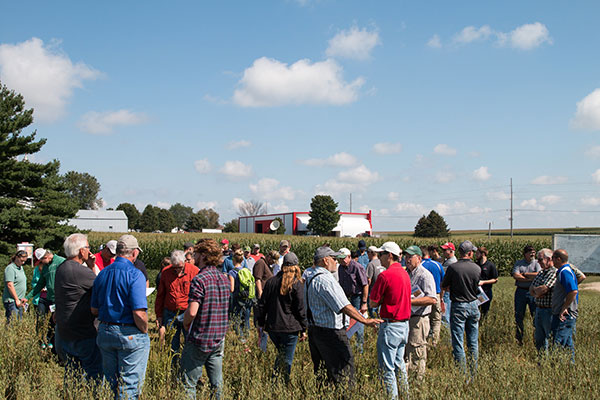
Badger Crop Connect
See new webinars and catch up on previous topics such as drought, cover crops, and more
Reverse Mortgage Considerations
What are the advantages & disadvantages that come with a reverse mortgage?

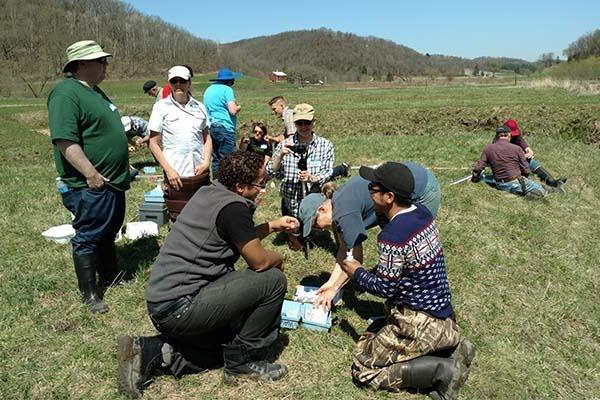
Be a Stream Monitor
Join hundreds of Water Action Volunteers around Wisconsin who monitor the health of their local streams.
Latest News
- UW–Madison Extension awarded nearly $340,000 in grant funding to 13 projects that bring innovation to the division’s outreach mission. Each year, Extension seeks proposals for new projects that find innovative solutions to address challenges facing Wisconsin communities. Engaging Youth in Monitoring Aquatic Species Using Environmental DNA (eDNA)Amy Workman, Natural Resources Institute This project will engage […]
- Day of the Badger starts Tuesday, April 16 at 10:12 a.m. and runs through Wednesday, April 17 at 5 p.m. (that’s 1848 minutes if you’re counting)! Donate to one of our participating programs: Extension Fund Extension is a public service that connects people with UW-Madison and engages with them in transforming lives and communities. Extension […]
- While running elections is an important role for municipal and county clerks, that’s not the only thing they do. Ann Hempel, elected to serve as the part-time Municipal Clerk for the Town of Unity in 2023, estimates that running elections for the 513 people who live in her township is only 5% of her clerk […]
- UW–Madison Extension is excited to announce the 10 projects selected to receive the 2024 Wisconsin Idea Collaboration (WIC) Grants. This year’s projects engage nine UW schools and colleges. Research topics include the economic benefits of broadband, water quality, PFAS and more. WIC Grants is a collaboration of Extension and the Office of the Vice Chancellor […]
- Christine Bender remembers the moment 10 years ago when she told her parents she wanted to come back and farm long-term. “My mom started to cry because she was so happy,” Bender said. In the decade since Bender and her family created a succession plan, they’ve had many discussions about working together. Now she serves […]
Extension’s Work Reaches Across Wisconsin
We help more than 200,000 farmers, parents, youth leaders, neighbors and businesses through our six program areas

Know what you’re looking for?
The Wisconsin Idea
Extension’s Role
UW-Madison is a public university guided by public service. The Wisconsin Idea stipulates that education should influence people’s lives beyond the boundaries of the classroom.
Extension brings the research of the University to the people of Wisconsin. Our offices throughout the state provide educational opportunities in the communities where people live and work.
I shall never be content until the beneficent influence of the University reaches every family of the state.
UW President Charles Van Hise in 1905