The Data Jam Toolkit consists of three documents that will help you plan and execute your data jam. Additionally, you will find information on Adult Education principles in Data Jams, Literature on Data Jams, and example products from Data Jams on this website.
Please contact Christian.Schmieder@wisc.edu if you have any questions or if you would like to request coaching and consulting services related to Evaluation Capacity Building through Data Jams.
Free PDF Data Jam materials:
Planning a Data Jam
Using QualPal to prepare for Data Jams and execute Data Jams
Customizable agenda for a 2-day Data Jam
An approach to analysis skill building grounded in Adult Education principles
Data Jams are not an analysis method – they are an approach to teaching qualitative analysis, and a support tool for mentorship of analysts. Data Jams are intentionally designed to create spaces for Legitimate Peripheral Participation (Lave & Wenger, 1991), i.e. they are spaces in which less experienced analysts have an opportunity to work with more experienced analysts on authentic tasks within a safe environment. Data Jams are designed to bring people together around shared analytic tasks and around a shared desire to learn collaboratively; as such, they are a powerful tool to foster and authentically convene communities of practice (Wenger & Trayner, 2015).
The tangible goal of Data Jams is to walk away with a useful, material analysis product. This focus on ‘learning-by-making’ grounds our approach deeply in the tradition of constructionism (Papert & Harel, 1991). Data Jams are essentially pop-up methods makerspaces (Schmieder, 2020), since they are “informal sites (…) where people of all ages blend digital and physical technologies to explore ideas, learn technical skills, and create new products.” (Sheridan et al, 2014).
As an approach to qualitative methods pedagogy, Data Jams are designed to translate (Woolf & Silver, 2018) between analytic tools (such as Qualitative Data Analysis Software) and analytic method. A discussion of Data Jams as an approach to methods pedagogy has been provided by Silver, Bulloch, Salmona & Woolf in the Handbook of Teaching and Learning Social Research Methods (Nind, 2023)
Literature related to Data Jams
- Christina Silver, Sarah L. Bulloch, Michelle Salmona & Nicholas W. Woolf (2023): Integrating the online teaching of qualitative analysis methods and technologies: challenges, solutions and opportunities. In Nind M (ed.) Handbook of Teaching and Learning Social Research Methods. Edward Elgar Publishing, pp 316-331.
- Christian Schmieder (2020): Qualitative data analysis software as a tool for teaching analytic practice: Towards a theoretical framework for integrating QDAS into methods pedagogy. In: Qualitative Research, 20(5), pp. 684-702.
- Christian Schmieder / Kyrie E.H. Caldwell / Ellen Bechtol (2018): Readying Extension for the Systematic Analysis of Large Qualitative Data Sets. In: Journal of Extension 56(6), Article 26.
- Christian Schmieder (2017): Constructing and Using a Large Organizational Dataset: Identifying Equity Practices in an Institutional Civil Rights Database. In: Woolf, Nicholas H. & Silver, Christina:: Qualitative Analysis Using MAXQDA: The five-level QDA method. New York: Routledge. Pp. 177-190.
How we use Data Jams
Evaluators and outreach educators at the UW-Madison – Division of Extension use the Data Jam model in one-day and multi-day Data Jams, and as the capacity building and consulting model for internal and external teams of researchers, graduate students, evaluators and outreach educators. In addition, we have successfully used Data Jams in various academic qualitative research classes for graduate and undergraduate students. Overall, our team has successfully facilitated over 100 full workshop days using this model (2016 and 2023). We have hosted or supported Data Jams across the United States, including the University of California Cooperative Extension, the University of Washington Extension, the University of Minnesota Extension, the University of Iowa Extension and at the United Nation’s Office of Internal Oversight Services (OIOS).
Example Products from Single-Day Data Jams
The most important feature of Data Jams at the Division of Extension is that we work with data and questions that are relevant to our colleagues; in fact, most topics in Data Jams are brought up by specialists and educators from across the state. By collaboratively analyzing programming narratives and impact statements from our central data collection system, we start answering questions like:
- How are equity principles enacted in our Community Food Systems-related work?
- How do our colleagues state-wide frame their work around ‘poverty’?
- How does state-wide programming in Agriculture and Natural Resources address Quality Assurance?
- How are youth applying what they’ve learned in terms of life skills in our state-wide 4-H and Youth Development programming?
- How does FoodWIse (our state-wide nutrition education program) partner with other organizations, both internally and externally?
In this section, you can view some of the products we’ve been making at Data Jams. Keep in mind that these are products that were made in one workshop day; they’re not research reports, but rather analytic write-ups that create the foundations for subsequent work.
Poverty as Synergetic Programming Focus in Milwaukee
Angela Allen, Educator, Community, Natural Resource and Economic Development / Maria Habib, Educator/Assistant Professor, 4-H & Youth Development / Christian Schmieder, Qualitative Research Specialist, Program Development & Evaluation
Question & Scope of Analysis
Question: How is poverty in Programming in Milwaukee framed through the lens of food security? More specifically: What are the indirect connections to the SEED areas of focus across educational priority & program areas?Scope: We started with the “Progress towards Outcomes” section in programming results narratives for Milwaukee County; we then also reviewed the remaining narrative to add context. We are using narratives reported by community-based educators to review the 3 SEED areas of focus: (1) food security & wellbeing, (2) Community Building, and; (3) Financial Opportunities.
Methodology/Process
We first created a set with results narratives from Milwaukee. We then used the Summary Grid to write notes that described how the programming effort would relate to the SEED initiative areas of focus. We started by looking at the Outcomes section of the Results Narrative and also read the full narratives for more context. As we took our notes we repeatedly stepped back and tried to classify the connections that we saw into bigger themes. We then made a visual map that shows the connections of each programming effort in Milwaukee with the SEED initiative.We found 17 results narratives specific to food security and poverty in Milwaukee County programming (2015). We reviewed all 17 narratives, and organized their connection to the SEED Initiative by establishing 6 categories by which we organized the relationships each program narrative has to current and future SEED Initiative programming opportunities.
Findings
The analysis showed that almost all programs in Milwaukee are related to how Extension responds to the issue of poverty, and it highlights Extensions’ unique potential to address the issue on a broad systemic front: 15 of 17 programming efforts have interconnections with Food Security – be it based on content, educational approach, program planning or strategies to expand access or otherwise meet the needs of underserved audiences.
- Connecting similar audiences and resources statewide. 5 existing programs allow the SEED initiative to connect to similar audiences and resources statewide, mainly through UWEX groups and teams that work statewide.
- Connection with existing UWEX underserved audience partners. 4 existing programs promise to expand the access of the initiative by tapping into partner networks that already exist, or are long-term.
- Tie-Ins into existing programming. 9 existing programs promise either to provide tie-ins for SEED, or promise to be opportunities to tie in SEED itself.
- Understanding programming context by tapping into UWEX resources. 3 existing programs can provide data and broader understanding of our programming context for SEED.
- Communicating and showing the value of our work. 3 existing programs promise to show the value of the systemic efforts around food security. This can help SEED to build trust and potentially scale the effort
- Learn from UWEX successes. 5 existing programs are opportunities for the SEED initiative to learn from other colleagues successes, for example regard volunteer management. Other Milwaukee programs have demonstrated local and national recognition as successful volunteer management programs. These programs can support SEED as it develops.
- Two narratives did not provide sufficient information.
Next Steps
The Milwaukee County office can use the Data Jam workshop model to more deeply understand how the SEED initiative and existing programming connect. This not only allows synergies and expansion of programming; it also fosters a commonly shared understanding around Food Security and Poverty amongst colleagues.
Barriers in Providing Nutrition Education Services to Latino Audiences
Alana Perez-Valliere, Nutrition Educator, Kenosha County / Eloisa Gomez, Director, Milwaukee County Extension Office / Christian Schmieder, Qualitative Research Specialist, Program Development & Evaluation
Question & Scope of Analysis
Question: For the Latino and Hispanic audiences, what the common barriers in providing nutrition education services?
Scope: Educational results narratives that describe outreach work focusing on Latino and Hispanic audiences and nutrition education content (we did a word search including WNEP, Nutrition Education, EFNEP, and SNAP). Using the Data Jam set, we will start by looking at common barriers and successes within the flagged content (barriers field) and continue on from there.
Findings
- One of the common barriers identified was a demand for bilingualism in our programming. So far we identified three strategies that colleagues mentioned to meet this demand:
- Having more bilingual educators on staff
- Having readily available translated products
- Having relationships with intermediaries
- Interpretation
In the afternoon, we discussed possible implications of these different strategies in the context of programming for Latino/Hispanic audiences.
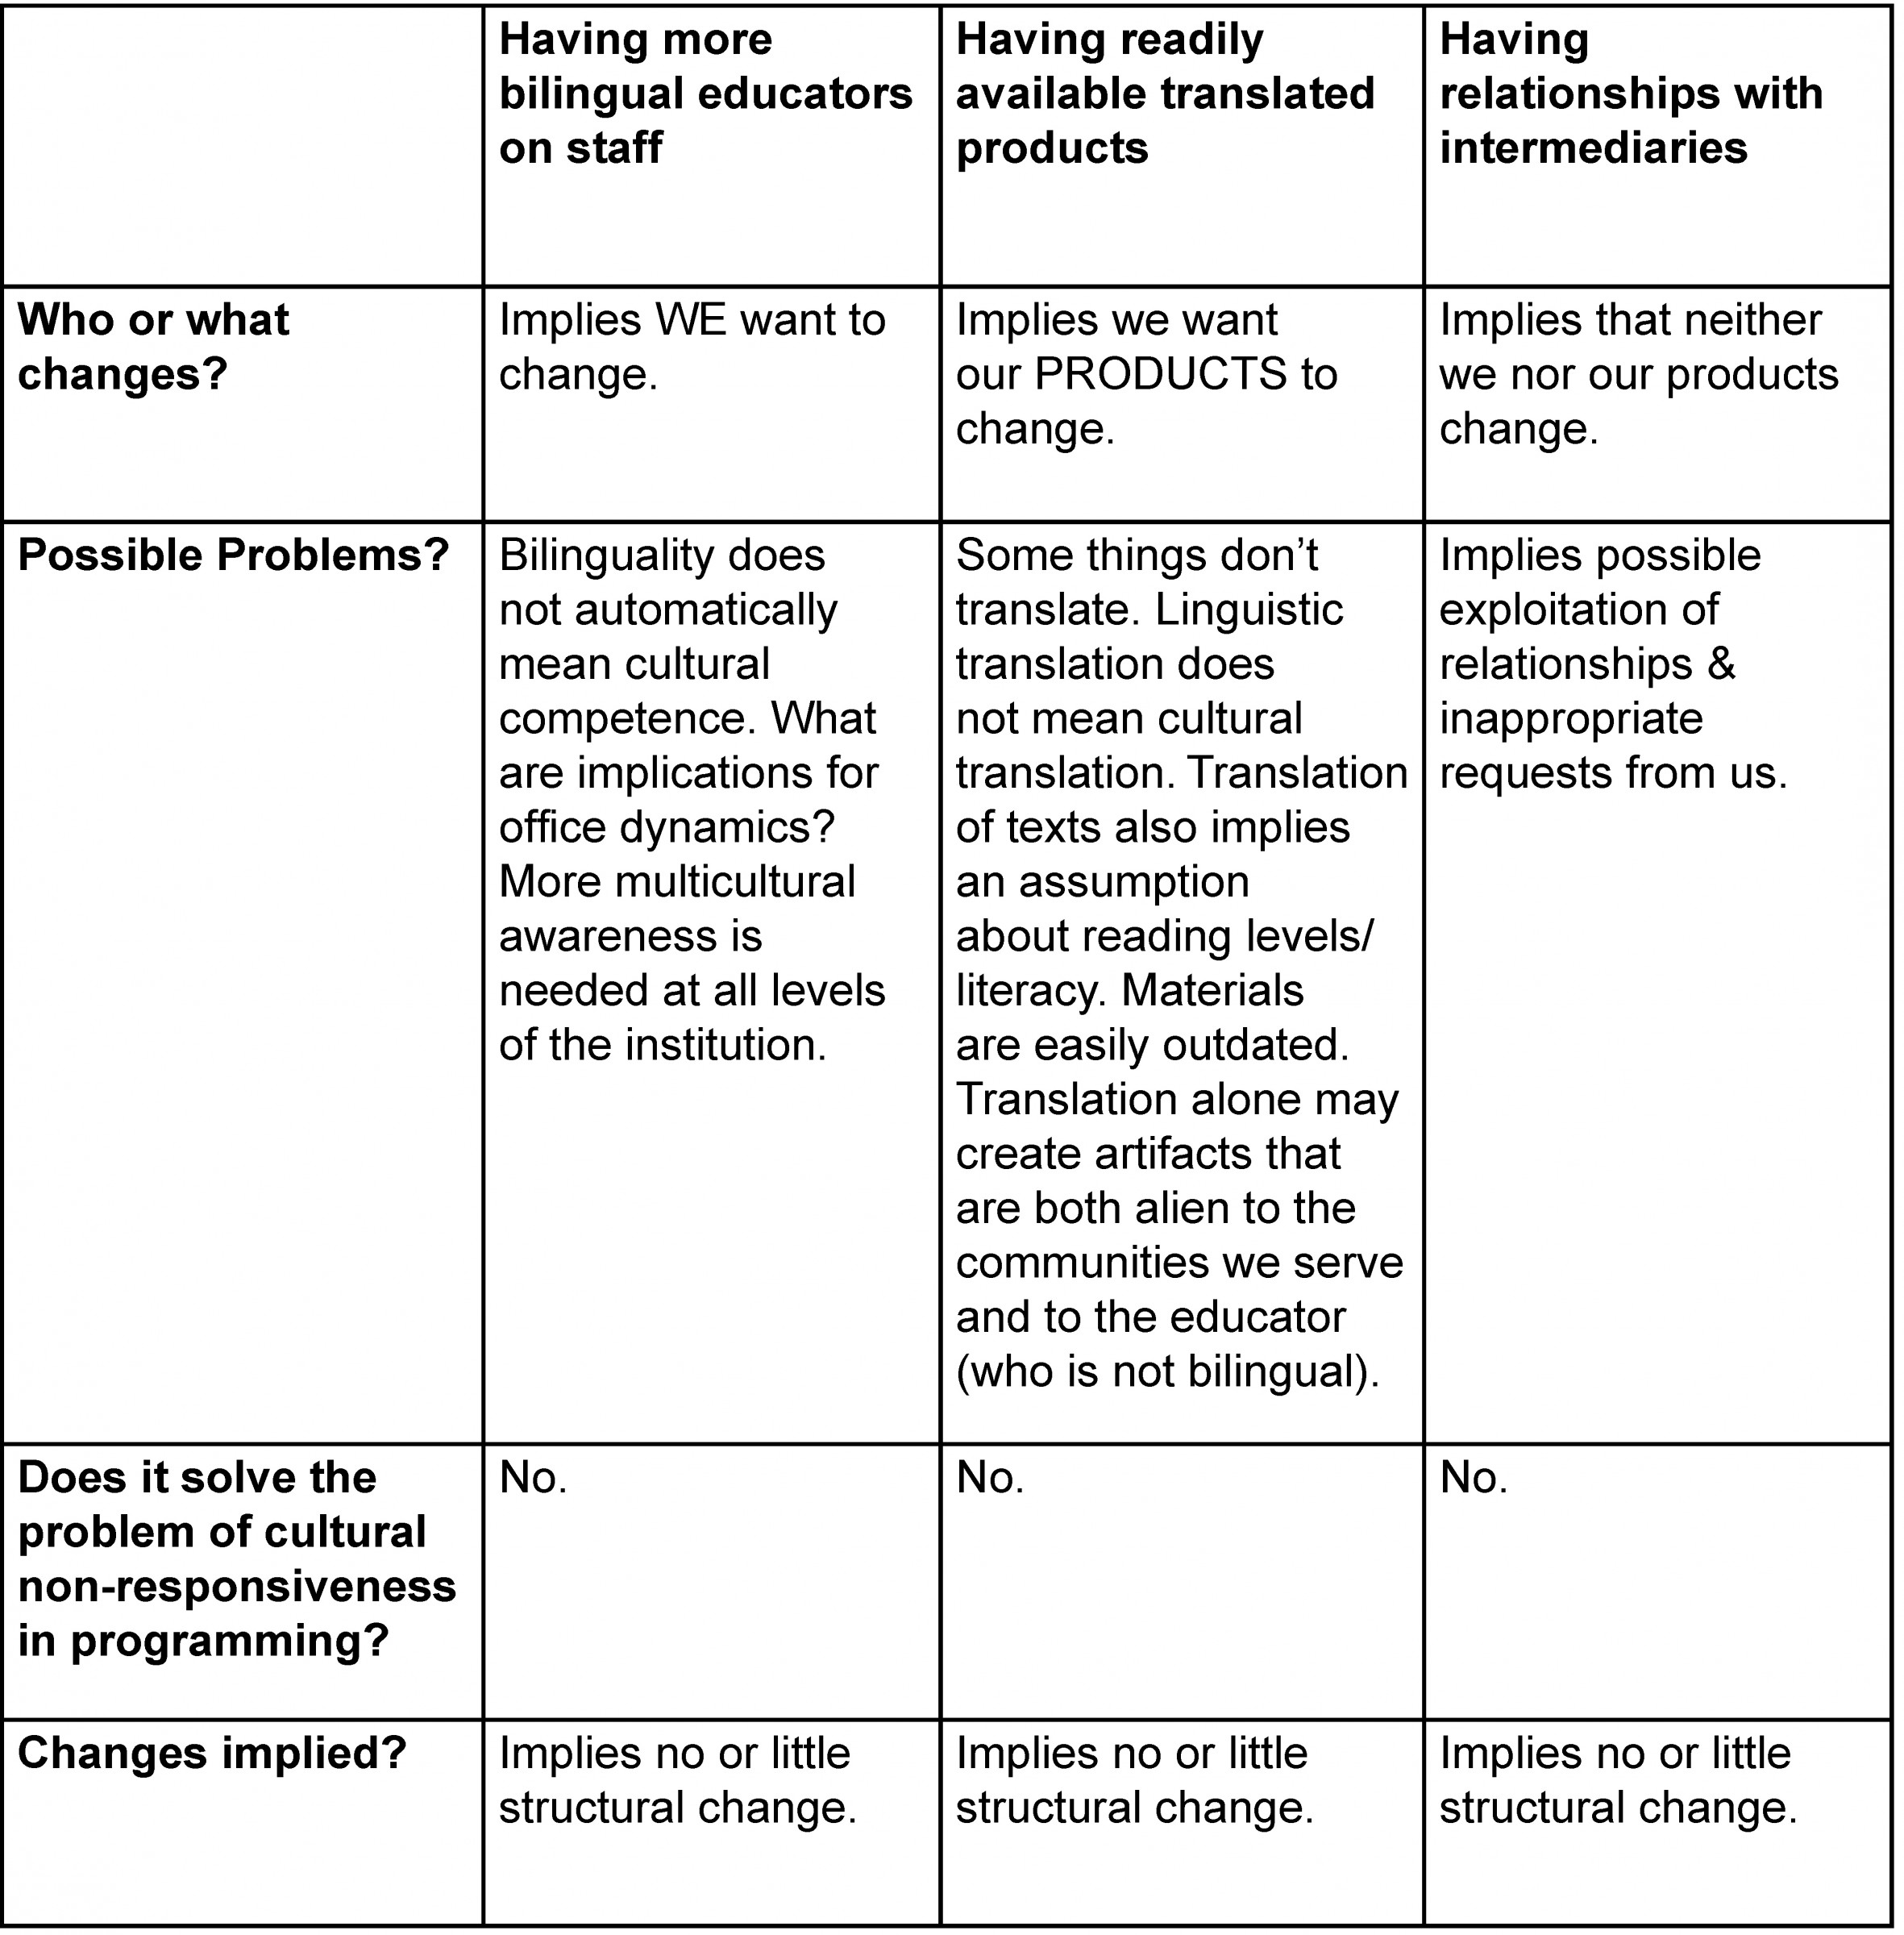
Language may be the surface problem, but ‘fixing’ language differences does not automatically create culturally responsive, thus successful programming. We only looked at a small amount of data, but in none of the Access Records, we saw an explicit call for culturally responsive staff who are knowledgeable of the community they serve.
Cultural responsiveness includes common language, but it is not limited to language. Adding and developing culturally responsive staff, in our opinion, implies an understanding & responsiveness to/of a demand in the community, and implies that we want to be effective change agents. It also implies that we are seeking structural change in our institution that is necessary for success.
Next Steps
As next steps we would look at other barriers/demands that we identified, and would focus on other program areas.
Institutional Barriers in Expanding Access throughout Wisconsin
Kerry Zaleski, Program Development and Evaluation Specialist (former), Program Development & Evaluation / Ellen Bechtol, Qualitative Research Assistant (former), Program Development & Evaluation
Question & Scope of Analysis
Question: What strategies are colleagues using to overcome institutional barriers (structural, systemic, organizational, beyond colleagues’ control) in expanding access to programming? By systemic, we are looking not only at UW-Extension but also at counties and other partners.
Scope: Educational results narratives, specifically sections focusing on: Barriers, Efforts Used, and What Have You Learned? (these are all Access-related fields). Using the Data Jam Data Set, we will start by looking at the first 10 cases going through each field listed previously and coding for barriers.
Findings
- Systemic barriers exist.
-
- Program content is not culturally relevant.
- Program administration creates barriers for certain audiences, are not user-friendly.
- Educators are not adequately prepared to work with audiences.
- Communication with and between partners is not always clear – goals and ways of working can be at odds with each other.
- Sanctioning of program doesn’t allow educators to adapt (*this came from our discussion of findings). Educator becomes the problem rather than the program.
- Colleagues are using strategies to cope and address symptoms of these barriers as best they can, but the barriers remain because they are nuanced, multi-faceted, and deeply rooted.
The relationships between these point back towards the planning and development process of engaging new audiences. Expanding access is not simply replicating already existing program designs but thinking about how to design programs to be culturally relevant/learner centered from the beginning. This requires a holistic, multi-disciplinary approach. Culturally relevant program design as a best practice relies on many different elements and considerations. How can we better integrate programming and create adaptive programs rather than static programs?
Elements of culturally relevant, holistic programming include…
- Educator/staff/partner training: addressing biases and assumptions, do no harm/ethics, legal responsibility, dealing with sensitive issues, working with vulnerable populations, boundaries. How well are we training colleagues to think about different world views and challenge and examine their own biases and assumptions?
- Protocols and processes should be in place that support this work and educators
- Understanding the community and potential impacts/unintended consequences of programs,
- Engaging multiple perspectives throughout the program cycle, especially during planning and design stages.
Next Steps
Look at more data and start to build an evidence base demonstrating a need for a stronger focus on culturally relevant program design.
Supporting Partnerships in FoodWIse Nutrition Education Programming
Nancy Coffey, FoodWIse Nutrition Coordinator, Eau Claire County / Claire Mance, Healthy Communities Coordinator, Dane County / John Pinkart, FoodWIse Program Coordinator, Oconto County / Christian Schmieder, Qualitative Research Specialist, Program Development & Evaluation
Question & Scope of Analysis
Question: What are the outcomes associated with UW Extension FoodWIse programs? Specifically, how is FoodWIse supporting community partners and what are the outcomes?
Scope: The data set for FoodWIse educational impact statements. This data set was created through auto-coding for (i.e. searching for and then tagging Impact Statements that include one of these terms in an organizational code for easy retrieval) the terms “WNEP”, “Food Wise”, and “FoodWIse.” We then auto-coded for “partners” and “support,” which retrieved the 67 full Impact Statements that comprised the data considered during this Data Jam.
Findings
We found that our impact statements so far fit in three different groups: Six Impact Statements show how our work influences the direction and development of the partners we have worked with. Typically our direct education plays a role in this, which we will elaborate on below. In one Impact Statement, an educator solely talked about delivering programming for a partner. In two Impact Statements, we found information on how we collaborate with other Extension colleagues in broader programmatic efforts.
WE PROVIDE PROGRAMMING FOR PARTNERS…
- …and our partners help us reach our target audience.
- EXAMPLE: FoodWIse (FW) partnered with the Women Infants and Children (WIC) Program and provided education to 9 La Crosse County women and their children. FW was able to provide education for WIC participants. The WIC partners supported FW in accessing/recruiting learners where trust had already been established. This statement described a somewhat more rigorous level of involvement with WIC learners than is typically offered: a longer-series of lessons.
WE SUPPORT BROADER EFFORTS WITH EXTENSION COLLEAGUES
- In an example from Waukesha, a Family Living colleague provides historical context (i.e. her “institutional knowledge”) for the current coalition group which includes colleagues from FW. A FL educator supports a FW coordinator in the context of collaborating with a common partner.
- In an example from Rock County, FL & FW educators combined curricula to respond to obesity concerns in childcare settings, thus adding content to existing FW curricula. This is an example of combining direct ed & PSE work. The expertise of both colleagues made the programming effort stronger.
WE ARE INFLUENCING DIRECTION AND PROGRAM DEVELOPMENT OF PARTNER ORGANIZATIONS
…by supporting their program development and delivery.
- In Marathon County, a FW coordinator is a member of a coalition. The FW coordinator performed planning, outreach, direct education, and evaluation efforts for a grant. In other words, the coordinator provided structural support on all levels of the grant effort.
- In Vilas County, FW staff supported a school to plan the development and implementation of a grant funded programming effort. This effort moved beyond direct education through the grant implementation and community interviewing process. The school acquired the grant and access to the school participants.
…by developing and delivering programs ourselves.
- In Burnett County, a educator worked with a partner to align the partner’s efforts with a FW educational focus, in this case, increasing fruit & vegetable consumption.
…by responding to their emerging needs, by being connected with stakeholders/key informants.
- In Iron County, a FW educator responded to the emerging needs of seniors based on site managers’ assessments at senior meal sites. In case, the managers mentioned several nutrition topics that needed to be addressed. Based on their needs identification, the FW educator built programming around needs which reinforced the opportunity to create impact through a longer term educational series.
…by providing evidence and materials that allow them to elevate issues in their organizations, which can lead to policy, systems, and environmental changes.
- In an example from Menominee County, we see several partnership functions including program delivery at a partner site and strategizing with on site staff concerning adding additional healthy foods to the offerings: In this case plain, bulk popcorn. The FW coordinator shared education materials that were shared with their larger organization, so popcorn could be available to more pantries. The direct educational effort and programmatic evaluation and evidence is initiating a policy change in the larger organization, which is currently pending.
- In a programming effort in Rock County, programming was provided at six child care centers serving low income audiences to improve health policies; an outcome of this education for daycare staff resulted in daycare health policy changes.
Additional observations & conclusions
We made the observation that direct teaching may create opportunities to conduct multi-level PSE efforts, and that conversely PSE work may also create opportunities to conduct direct education. We saw examples of both in the statements that we reviewed.
We should keep in mind that our teaching can have significant impacts on how the partner organization changes or creates policy (the question is: are these intended or unintended outcomes). One idea we had from looking at the examples was: sample size might not always matter. This may suggest the importance of trust in this process, as a factor that could be just as powerful as results purely based on participation numbers. For example, Laura Robinson in Menominee County had four participants in a direct education lesson; however, the lesson caught the interest of the food pantry dietitian, who presented on the issue of adding healthier whole grains to food pantries at his/her larger organization. I.e. our direct education rippled to the food distribution level – and this is not necessarily contingent on n-size of programming.
Team Analysis Session: Food Safety and Quality Assurance in Agriculture and Natural Resources
David Williams, Associate Program Director, Agriculture and Natural Resources Extension / Lorre Kolb, Public Information Specialist, Agriculture and Natural Resources Extension / Kyrie Caldwell, Qualitative Research Assistant, Program Development & Evaluation
Questions & Scope of Analysis
Questions:
- How does ANRE programming address Quality Assurance, broadly, and more specifically, the Veterinary Feed Directive?
- Which ANRE educators are working on these topics, and what are ways in which they have done so? What kinds of results are they finding? That is, what kinds of stories on these topics are present in our educators’ programming records and can be used to present the value of ANRE’s educational and other programming to various stakeholders?
Scope: We looked at ANRE Impact Statements and Results Narratives from 2016, focusing on key terms that would retrieve data on Food Safety and Quality Assurance.
Preliminary Findings
Audience: Agricultural service providers include veterinarians, feed suppliers, marketing channels, and others.
Partnerships: Partnerships reflected in these narratives can be another avenue for expressing programming value, both to express to stakeholders the impact of our current partnerships as well as expressing colleagues’ work to current and potential partners. Partnerships include K-12 educational entities, higher education entities (including technical colleges and UW System institutions and researchers),
Value Chain: The value chain reflected in these narratives provides a fuller story of the value our programming provides in farm-to-table quality assurance.
Role/Scope: These narratives, which are research rather than profit based, show the value of Extension’s network at federal (FDA), state (trade and regulatory entities), and local (producers, service providers, and consumers) levels for providing education to a segment of Wisconsin’s agricultural producers, service providers, and ultimately consumers.
Cross-Program Area Exploration: ANRE is interested in comparing its own evaluation data with those from other states on programs for implementing the VFD regulation.
Summaries of Interest:
- In response to a new USDA FDA regulation pertaining to antibiotics in feed, and to a resulting veterinary feed directive, educational programs were developed and delivered to meets the needs to veterinarians, producers, agricultural service providers, so that the new regulation could be implemented.
- Our colleagues’ stories are beginning to reflect food safety, reducing antibiotics in consumer foods, building consumer confidence in the meat industry, and financial impact for producers.
- Our overview analysis revealed that VFD initiatives were integrated into preexisting programming.
Next Steps
- To capture as much of the data as possible, we will finish coding and summarizing the Results Narratives on Food Safety and Quality Assurance.
- We will include the descriptive and summative information from this topic area in three of the 2016 Federal Report for Planned Programs.
- We will submit the information to a national database for agricultural programming.
- We will create ANRE communications and marketing materials based on the data we found and our analyses thereof.
Team Analysis Session: Water Quality in Agriculture and Natural Resources
Lorre Kolb, Public Information Specialist, Agriculture and Natural Resources Extension / Kyrie Caldwell, Qualitative Research Assistant, Program Development & Evaluation
Questions & Scope of Analysis
Questions:
- How does ANRE programming address Water Quality?
- Which ANRE educators are working on these topics, and what are ways in which they have done so? What kinds of results are they finding? That is, what kinds of stories on these topics are present in our educators’ programming records and can be used to present the value of ANRE’s educational and other programming to various stakeholders?
Scope: We looked at ANRE Impact Statements and Results Narratives from 2016, focusing on key terms that would retrieve data on Water Quality as it relates to agricultural efforts.
Preliminary Findings
We determined that our product output is both a series of questions (captured below), which we feel can help program leadership consider what can be asked of the data we have now and develop rubrics for data collection in future, as well as the Data Dive MAXQDA file itself. This file includes our defined and populated codes, process notes, relevant document sets, and other such structural elements that will allow program leaders and educators to quickly access data related to the areas we considered across the entire Data Dive and to access guidance in how to conduct similar queries and analyses in different topical areas.
Questions for UW-Cooperative Extension Program Area Leadership
- What kinds of questions can be answered with the current Recording Results data? What kinds of questions could be answered with changes to Recording Results data collection?
- What needs to be expressed in training and directive efforts on writing Impact/Outcome Statements? How might that differ for Results Narratives? What forms might that training/direction take?
- How can we encourage colleagues to make explicit and data-driven connections between programming and outcomes?
- What kinds of evaluations would be most helpful (e.g. formative or summative)? How should those evaluations be reported in Recording Results?
- How might colleagues best record long-term/ongoing programs that do not fit neatly in year-long cycles?
- What kinds of follow-ups would be most in showing the impact of such programs on long-term behavioral change? How should those follow-ups be reported in Recording Results?
- How might changes in the rhythms of Recording Results data collection help colleagues who work on long-term projects express the value of these projects?
- How does our data collection and analysis around Recording Results reflect program area content, goals, needs, etc.?
- Are all colleagues on the same page when addressing commonly-used terms and concepts?
- How do we define terms we feel are important?
- How do we express these definitions to colleagues and have them implement these terms in a way that makes sense to these definitions?
- How do we express these terms and their definitions to external audiences and stakeholders?
- Why look for data on programming around particular topics/content areas?
- Why is water quality (or any such topic) important?
- Why is Extension’s involvement in water quality issues important?
- Are all colleagues on the same page when addressing commonly-used terms and concepts?
-
- What is the unique value of Extension’s specific interventions and interventional capabilities?
- What is the value of Extension educators’/agents’ time spent on projects—especially value that cannot be expressed numerically?
Next Steps
- We plan to finish coding the Impact Statements and the Results Narratives we did not reach during the Data Dive.
- We will distribute our data management structure and process notes so that ANRE leadership and colleagues can use it to locate and analyze data relevant to their projects, and also so that colleagues in other program areas can not only similarly locate and analyze the work of ANRE colleagues, but also use our data management structure as a model to help them create their own.
- We will present our series of prompts to program area leadership as suggestions for what kinds of questions to keep in mind when asking for data analysis work and reports, so that when analyzing data, colleagues will be best able to answer questions that are maximally useful for program area leadership.